
This guest post is an exchange between Richard Neher and the authors of the preprint “Loss and Recovery of Genetic Diversity in Adapting Populations of HIV” (Pleuni Pennings, Sergey Kryazhimskiy, and John Wakeley). Below is the comment from Richard Neher, and then appended is the response from the authors of the study.
In this paper, the authors use a data set from a study of the anti-HIV drug efavirenz. This drug has a fairly stereotypic resistance profile which in most cases involves a mutation at amino acid 103 of the reverse transcriptase of HIV (K103N). The authors examine sequences from patients after treatment failure (drug resistant virus) and observe that in a large fraction of the cases, the drug resistance mutation K103N is present on multiple genetic backgrounds or in both of the possible codons for asparagine. This suggests frequent soft sweeps, i.e., evolution of drug resistance is not limited by the waiting time for a point mutation.
The observation of frequent soft sweeps allows to put a lower bound on the product of population size and mutation rate. Since the mutation rate is on the order of 1e-5, the lower bound for the population size is around N>1e5. The authors suggest that the fact that not all patients exhibit obvious soft-sweeps can be used to deduce an upper bound of N. However, one has to realize that the patient sample is heterogeneous, that additional drugs are used along with efavirenz, and that most likely additional mutations have swept through the population. Multiple soft-sweeps in rapid succession will look like hard sweeps. The lower bound makes a lot of sense and does away with a long held erroneous belief that the “effective” HIV population within an infected individual is small.
The debate about the size of the HIV population has some interesting history. In the mid 90ies, it was estimated that roughly 1e7 cells are infected by HIV within a chronically infected patient every day. Virologists studying HIV evolution concluded that every point mutations is explored many times every day (see Coffin, Science, 1995, http://www.ncbi.nlm.nih.gov/pubmed/7824947), which was consistent with the frequent failure of mono-therapy, i.e., therapy with only one drug. Around the same time, it was observed that HIV sequences within a patient typically have a common ancestor about 3 years ago, which translates into roughly 500-1000 generations. Population geneticists then started to convince people that this rapid coalescence corresponds to an “effective” population size of the order of a 1000, and that this explains the observed stochasticity of HIV evolution. Not everybody was convinced and some went through great trouble to show that very rare alleles matter and that the population size is large, see for example http://jvi.asm.org/content/86/23/12525. In this paper, failure of efavirenz therapy is studied in monkeys. Despite the fact that the resistance mutations were at frequencies below 1e-5 before treatment, both codons for asparagine at position 103 are observed a few days after treatment. Via as similar argument as in the above paper, the authors conclude that the population size is large.
There is very little reason to believe that coalescence in HIV is driven by short term offspring number fluctuations (drift). Instead, the coalescence is most likely driven by selection in which case the time scale of coalescence depends weakly on the population size (see e.g. http://arxiv.org/abs/1302.1148).
The tendency of population geneticists to map everything to a neutral model has in this case of HIV produced much confusion. This confusion is easily avoided if people were willing to give up the concept of effective population size and simply call the time scale of coalescent what it is.
Response from Pennings et al.
Hi Richard,
Thanks a lot for your detailed comments.
We agree with most of your analysis, but let us explain why we believe that our estimate of the effective population size is not just a lower bound.
We use the observation of “soft” and “hard” sweeps to estimate the effective population size of the virus in a patient.
In 7 patients, a mixture of AAC and AAT alleles at the 103rd codon of RT replaced the wildtype, whereas in 10 patients either the AAT or the AAC allele replaced the wildtype.
When we only observe the AAC allele, it is still possible that this allele has several origins (the mutation from AAA to AAC occurred multiple times). This possibility is included in our analysis.
In addition, it is possible that originally, a mixture of AAC and AAT replaced the wildtype, but a subsequent sweep (at another site) removed one of the two alleles from the population (or reduced its frequency so that it doesn’t appear in the sample). You suggest that this process can explain our observation of hard sweeps.
We agree that this is a theoretical possibility, but we believe that our original interpretation is more parsimonious.
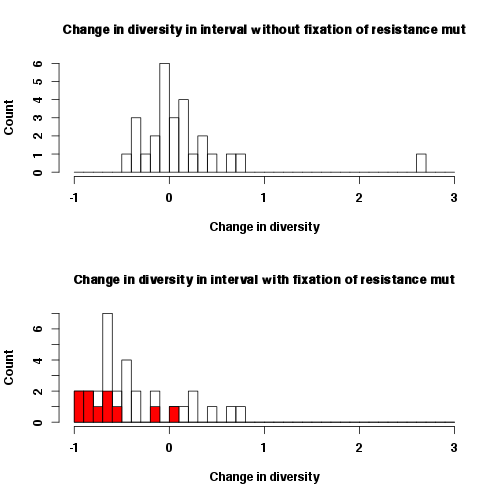
First, sweeps may be occurring regularly in all patients. In this case we do not expect any differences in diversity reduction in patients where the last sweep happened at a drug resistance codon versus patients in which another sweep was the last. Our data do not support this picture, because ongoing sweeps in all patients are not compatible with a significant and substantial reduction in diversity in the patients whose virus fixed a resistance mutation. Hence non-drug resistance related sweeps with a strong effect of diversity must be relatively rare in the viral populations.
We have plotted the reduction in diversity in intervals without the fixation of a resistance mutation and the in intervals with the fixation of a resistance mutation. The 10 patients in which only the AAC or AAT allele was observed are highlighted in red. The reduction of diversity in these intervals is quite severe and such severe reductions are not observed in the intervals without the fixation of a resistance mutations.
Second, it may be possible that, for some reason, the patients in which we see a hard sweep at site 103 actually had two or more sweeps (with the sweep at site 103 not being the last one) while patients in which we see a soft sweep had only one soft sweep at site 103. Then, indeed, the former set of patients would have a larger reduction in diversity than the latter set of patients, and this difference in reduction would NOT be due to fact that the former patients received only one resistance mutation. One potential scenario in which this could happen is if the time intervals during which the sweep occurred are systematically longer in patients in which we observe hard sweeps. However, this is not the case, see figure.

Another scenario is if there is a specific structure of epistasis among mutations in HIV. In particular, after the 103 mutation has fixed, another mutation or mutations become available which were not available before the K103N swept. These could be compensatory mutations, for example. In this case, in all patients there was a soft sweep at site 103. Following that, in some patients, the secondary mutation occurred and swept quickly, but in other it didn’t (just by chance). In those patients where it did occur and sweep, we see a larger reduction in diversity (including site 103) due to this secondary sweep. However, this would mean that the populations are limited by the supply of this secondary mutation rather then the K103N mutation, which seems unlikely (especially considering that after the K103N mutation the population size would have likely gone up). Also, if this were the case, the mutations that lead to the second sweep must occur relatively far away from the K103N site, otherwise they would have likely been discovered.
Finally, it can be that what looks like hard sweeps are indeed hard sweeps. We believe that this is, with our current knowledge, the most parsimonious explanation of our observations. Hence, the effective population size of the virus cannot be very large. This explanation is also compatible with the observation that resistance does not evolve in all patients.
Pleuni and Sergey (John is on vacation)

Hi Pleuni and Sergey,
thank you for your response. I guess most of our argument is semantics. Whether one or the other explanation is considered more “parsimonious” depends on what your baseline model is. But I guess we agree on the following:
* >1e7 cells are infected every day, at least in absence of treatment
* certainly not all of them infect new cells and the variance is large
* but Nmu is larger than 1 probably even for the lowest mutation rates.
* N has rather little to do with the time to the MRCA
I have seen many examples in HIV where 4-5 mutation sweep within 2 month, which is at the lower end of the time intervals you consider. Hence I still don’t see the argument for an upper bound. But I see that your observations are compatible with a population size below 5e5.
I don’t think it is terribly important to produce strict bounds for a quantity that is as poorly defined as the effective population size. Once Nmu is larger than 1, how large it really is does not matter all that much for many questions. From my interactions with clinicians, I get the impression that whether treatment fails depends primarily on the patient: Adherence, pharmacokinetics, health of the immune system, etc. While the evolutionary dynamics of the virus is clearly important, it happens in an environment that is changing rapidly and differs in many important aspects from patient to patient. This is difficult to model.
best,
richard
Pingback: Most viewed on Haldane’s Sieve: April 2013 | Haldane's Sieve
I uploaded more pictures & sequences of viral populations in more patients to Figshare: http://figshare.com/articles/LossAndRecoveryHIV/703928
Pingback: Some preprint comment streams at Haldane’s sieve and related sites | Haldane's Sieve