Lighter: fast and memory-efficient error correction without counting

Lighter: fast and memory-efficient error correction without counting
Li Song, Liliana Florea, Ben Langmead

Lighter is a fast and memory-efficient tool for correcting sequencing errors in high-throughput sequencing datasets. Lighter avoids counting k-mers in the sequencing reads. Instead, it uses a pair of Bloom filters, one populated with a sample of the input k-mers and the other populated with k-mers likely to be correct based on a simple test. As long as the sampling fraction is adjusted in inverse proportion to the depth of sequencing, the Bloom filter size can be held constant while maintaining near-constant accuracy. Lighter is easily applied to very large sequencing datasets. It is parallelized, uses no secondary storage, and is both faster and more memory-efficient than competing approaches while achieving comparable accuracy. Lighter is free open source software available from https://github.com/mourisl/Lighter/.

A Simple Data-Adaptive Probabilistic Variant Calling Model

A Simple Data-Adaptive Probabilistic Variant Calling Model
Steve Hoffmann, Peter F. Stadler, Korbinian Strimmer
(Submitted on 20 May 2014)

Background: Several sources of noise obfuscate the identification of single nucleotide variation in next generation sequencing data. Not only errors introduced during library construction and sequencing steps but also the quality of the reference genome and the algorithms used for the alignment of the reads play an influential role. It is not trivial to estimate the influence these factors for individual sequencing experiments.
Results: We introduce a simple data-adaptive model for variant calling. Several characteristics are sampled from sites with low mismatch rates and uses to estimate empirical log-likelihoods. These likelihoods are then combined to a score that typically gives rise to a mixture distribution. From these we determine a decision threshold to separate potentially variant sites from the noisy background.
Conclusions: In simulations we show that the proposed model is at par with frequently used SNV calling algorithms in terms of sensitivity and specificity. The application to next-generation sequencing data reveals stark differences of the score distributions indicating a strong influence of data specific sources of noise. The proposed model is specifically designed to adjust to these differences.

Long non-coding RNAs as a source of new peptides

Long non-coding RNAs as a source of new peptides

Jorge Ruiz-Orera, Xavier Messeguer, Juan A. Subirana, M.Mar Albà
(Submitted on 16 May 2014)

Deep transcriptome sequencing has revealed the existence of many transcripts that lack long or conserved open reading frames and which have been termed long non-coding RNAs (lncRNAs). Despite the existence of several well-characterized lncRNAs that play roles in the regulation of gene expression, the vast majority of them do not yet have a known function. Motivated by the existence of ribosome profiling data for several species, we have tested the hypothesis that they may act as a repository for the synthesis of new peptides using data from human, mouse, zebrafish, fruit fly, Arabidopsis and yeast. The ribosome protection patterns are consistent with the presence of translated open reading frames (ORFs) in a very large number of lncRNAs. Most of the ribosome-protected ORFs are shorter than 100 amino acids and usually cover less than half the transcript. Ribosome density in these ORFs is high and contrasts sharply with the 3UTR region, in which very often there is no detectable ribosome binding, similar to bona fide protein-coding genes. The coding potential of ribosome-protected ORFs, measured using hexamer frequencies, is significantly higher than that of randomly selected intronic ORFs and similar to that of evolutionary young coding sequences. Selective constraints in ribosome-protected ORFs from lncRNAs are lower than in typical protein-coding genes but again similar to young proteins. These results strongly suggest that lncRNAs play an important role in de novo protein evolution.

READemption – A tool for the computational analysis of deep-sequencing-based transcriptome data

READemption – A tool for the computational analysis of deep-sequencing-based transcriptome data

Konrad Ulrich Förstner, Jörg Vogel, Cynthia Mira Sharma

Summary: RNA-Seq has become a potent and widely used method to qualitatively and quantitatively study transcriptomes. In order to draw biological conclusions based on RNA-Seq data, several steps some of which are computationally intensive, have to betaken. Our READemption pipeline takes care of these individual tasks and integrates them into an easy-to-use tool with a command line interface. To leverage the full power of modern computers, most subcommands of READemption offer parallel data processing. While READemption was mainly developed for the analysis of bacterial primary transcriptomes, we have successfully applied it to analyze RNA-Seq reads from other sample types, including whole transcriptomes, RNA immunoprecipitated with proteins, not only from bacteria, but also from eukaryotes and archaea. Availability and Implementation: READemption is implemented in Python and is published under the ISC open source license. The tool and documentation is hosted at http://pythonhosted.org/READemption (DOI:10.6084/m9.figshare.977849).

Author post: qqman: an R package for visualizing GWAS results using Q-Q and manhattan plots

This guest post is by Stephen Turner on his preprint qqman: an R package for visualizing GWAS results using Q-Q and manhattan plots, available on bioRxiv here. This is a modified version of a post from his blog.

qqman: an R package for visualizing GWAS results using Q-Q and manhattan plots

Three years ago I wrote a blog post on how to create manhattan plots in R. After hundreds of comments pointing out bugs and other issues, I've finally cleaned up this code and turned it into an R package.

The qqman R package is on CRAN: http://cran.r-project.org/web/packages/qqman/

The source code is on GitHub: https://github.com/stephenturner/qqman

The pre-print is on biorXiv: Turner, S.D. qqman: an R package for visualizing GWAS results using Q-Q and manhattan plots. biorXiv DOI: 10.1101/005165.

Here's a short demo of the package for creating Q-Q and manhattan plots from GWAS results.

Installation

First, let's install and load the package. We can see more examples by viewing the package vignette.

# Install only once:
install.packages("qqman")

# Load every time you use it:
library(qqman)

The qqman package includes functions for creating manhattan plots (the manhattan() function) and Q-Q plots (with the qq() function) from GWAS results. The gwasResults data.frame included with the package has simulated results for 16,470 SNPs on 22 chromosomes in a format similar to the output from PLINK. Take a look at the data:

head(gwasResults)
  SNP CHR BP      P
1 rs1   1  1 0.9148
2 rs2   1  2 0.9371
3 rs3   1  3 0.2861
4 rs4   1  4 0.8304
5 rs5   1  5 0.6417
6 rs6   1  6 0.5191

Creating manhattan and Q-Q plots

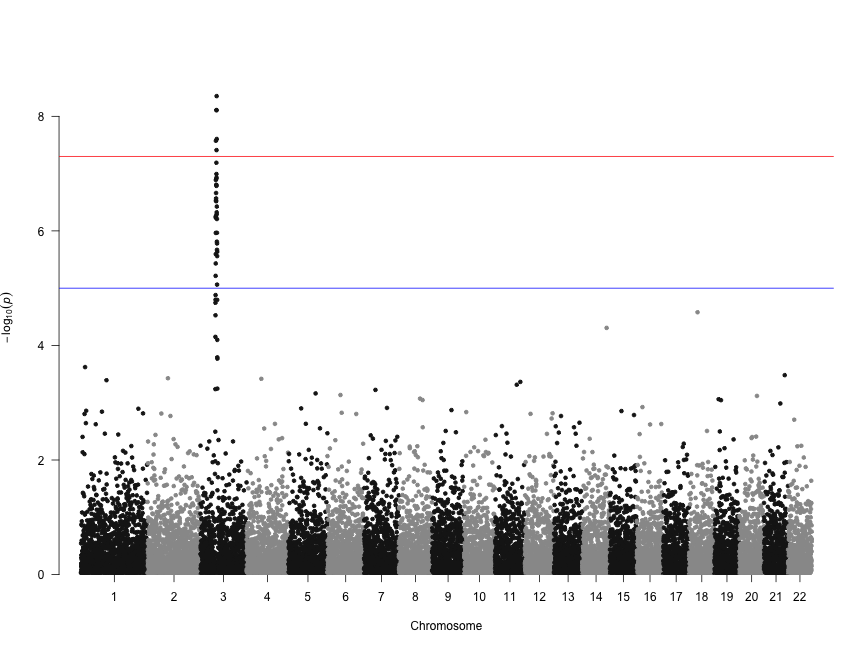
Let's make a basic manhattan plot. If you're using results from PLINK where columns are named SNP, CHR, BP, and P, you only need to call the manhattan() function on the results data.frame you read in.

manhattan(gwasResults)

manhattan_01_basic

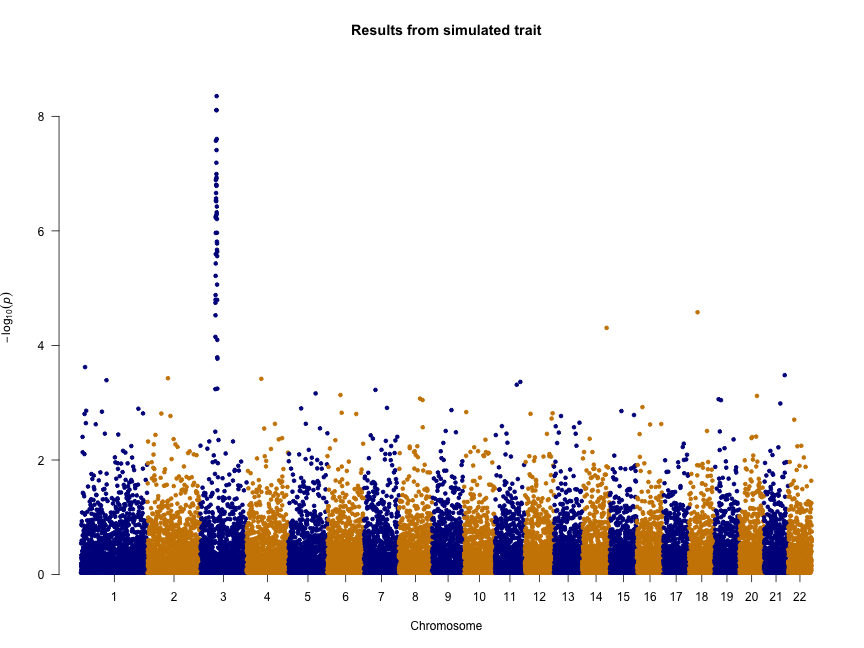
We can also change the colors, add a title, and remove the genome-wide significance and “suggestive” lines:

manhattan(gwasResults, col = c("blue4", "orange3"), main = "Results from simulated trait",
    genomewideline = FALSE, suggestiveline = FALSE)

manhattan_02_color_title_lines

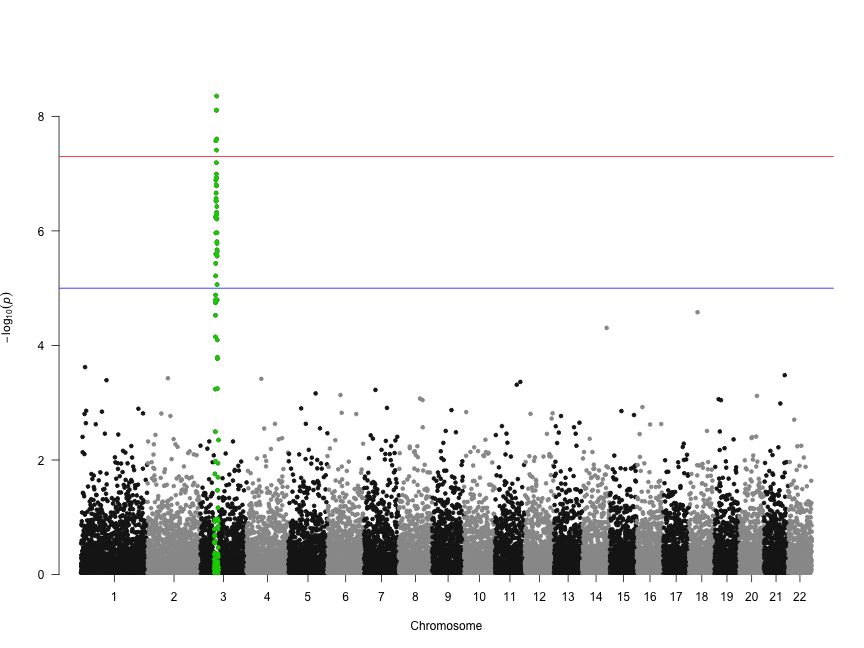
Let's highlight some SNPs of interest on chromosome 3. The 100 SNPs we're highlighting here are in a character vector called snpsOfInterest. You'll get a warning if you try to highlight SNPs that don't exist.

head(snpsOfInterest)
[1] "rs3001" "rs3002" "rs3003" "rs3004" "rs3005" "rs3006"
manhattan(gwasResults, highlight = snpsOfInterest)

manhattan_03_highlight

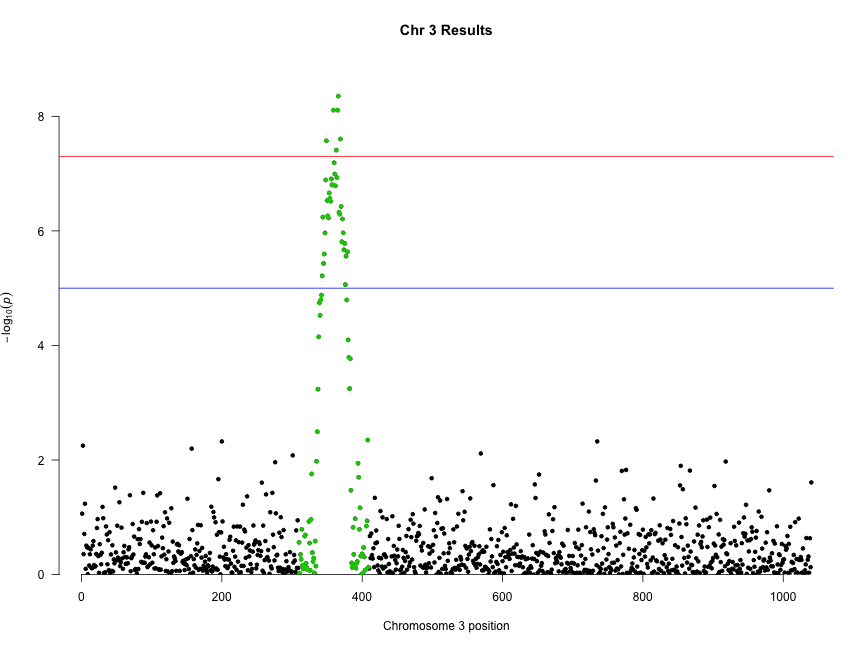
We can combine highlighting and limiting to a single chromosome to “zoom in” on an interesting chromosome or region:

manhattan(subset(gwasResults, CHR == 3), highlight = snpsOfInterest, main = "Chr 3 Results")

manhattan_04_highlight_chr

Finally, creating Q-Q plots is straightforward – simply supply a vector of p-values to the qq() function. You can optionally provide a title.

qq(gwasResults$P, main = "Q-Q plot of GWAS p-values")

qq

Read the blog post or check out the package vignette for more examples and options.

vignette("qqman")

qqman: an R package for visualizing GWAS results using Q-Q and manhattan plots

qqman: an R package for visualizing GWAS results using Q-Q and manhattan plots

Stephen D. Turner

Summary: Genome-wide association studies (GWAS) have identified thousands of human trait-associated single nucleotide polymorphisms. Here, I describe a freely available R package for visualizing GWAS results using Q-Q and manhattan plots. The qqman package enables the flexible creation of manhattan plots, both genome-wide and for single chromosomes, with optional highlighting of SNPs of interest. Availability: qqman is released under the GNU General Public License, and is freely available on the Comprehensive R Archive Network (http://cran.r-project.org/package=qqman). The source code is available on GitHub (https://github.com/stephenturner/qqman).

Nonspecic transcription factor binding reduces variability in transcription factor and target protein expression

Nonspecic transcription factor binding reduces variability in transcription factor and target protein expression

Mohammad Soltani, Pavol Bokes, Zachary Fox, Abhyudai Singh
(Submitted on 11 May 2014)

Transcription factors (TFs) interact with a multitude of binding sites on DNA and partner proteins inside cells. We investigate how nonspecific binding/unbinding to such decoy binding sites affects the magnitude and time-scale of random fluctuations in TF copy numbers arising from stochastic gene expression. A stochastic model of TF gene expression, together with decoy site interactions is formulated. Distributions for the total (bound and unbound) and free (unbound) TF levels are derived by analytically solving the chemical master equation under physiologically relevant assumptions. Our results show that increasing the number of decoy binding sides considerably reduces stochasticity in free TF copy numbers. The TF autocorrelation function reveals that decoy sites can either enhance or shorten the time-scale of TF fluctuations depending on model parameters. To understand how noise in TF abundances propagates downstream, a TF target gene is included in the model. Intriguingly, we find that noise in the expression of the target gene decreases with increasing decoy sites for linear TF-target protein dose-responses, even in regimes where decoy sites enhance TF autocorrelation times. Moreover, counterintuitive noise transmissions arise for nonlinear dose-responses. In summary, our study highlights the critical role of molecular sequestration by decoy binding sites in regulating the stochastic dynamics of TFs and target proteins at the single-cell level.

Sequence co-evolution gives 3D contacts and structures of protein complexes

Sequence co-evolution gives 3D contacts and structures of protein complexes

Thomas A. Hopf, Charlotta P.I. Schärfe, João P.G.L.M. Rodrigues, Anna G. Green, Chris Sander, Alexandre M.J.J. Bonvin, Debora S. Marks

High-throughput experiments in bacteria and eukaryotic cells have identified tens of thousands of possible interactions between proteins. This genome-wide view of the protein interaction universe is coarse-grained, whilst fine-grained detail of macro- molecular interactions critically depends on lower throughput, labor-intensive experiments. Computational approaches using measures of residue co-evolution across proteins show promise, but have been limited to specific interactions. Here we present a new generalized method showing that patterns of evolutionary sequence changes across proteins reflect residues that are close in space, and with sufficient accuracy to determine the three-dimensional structure of the protein complexes. We demonstrate that the inferred evolutionary coupling scores distinguish between interacting and non-interacting proteins and the accurate prediction of residue interactions. To illustrate the utility of the method, we predict unknown 3D interactions between subunits of ATP synthase and find results consistent with detailed experimental data. We expect that the method can be generalized to genome- wide interaction predictions at residue resolution.

Characterizing a collective and dynamic component of chromatin immunoprecipitation enrichment profiles in yeast

Characterizing a collective and dynamic component of chromatin immunoprecipitation enrichment profiles in yeast

Lucas D. Ward, Junbai Wang, Harmen J. Bussemaker

Recent chromatin immunoprecipitation (ChIP) experiments in fly, mouse, and human have revealed the existence of high-occupancy target (HOT) regions or “hotspots” that show enrichment across many assayed DNA-binding proteins. Similar co-enrichment observed in yeast so far has been treated as artifactual, and has not been fully characterized. Here we reanalyze ChIP data from both array-based and sequencing-based experiments to show that in the yeast S. cerevisiae, the collective enrichment phenomenon is strongly associated with proximity to noncoding RNA genes and with nucleosome depletion. DNA sequence motifs that confer binding affinity for the proteins are largely absent from these hotspots, suggesting that protein-protein interactions play a prominent role. The hotspots are condition-specific, suggesting that they reflect a chromatin state or protein state, and are not a static feature of underlying sequence. Additionally, only a subset of all assayed factors is associated with these loci, suggesting that the co-enrichment cannot be simply explained by a chromatin state that is universally more prone to immunoprecipitation. Together our results suggest that the co-enrichment patterns observed in yeast represent transcription factor co-occupancy. More generally, they make clear that great caution must be used when interpreting ChIP enrichment profiles for individual factors in isolation, as they will include factor-specific as well as collective contributions.

Graph-based data integration predicts long-range regulatory interactions across the human genome

Graph-based data integration predicts long-range regulatory interactions across the human genome

Sofie Demeyer, Tom Michoel
(Submitted on 29 Apr 2014)

Transcriptional regulation of gene expression is one of the main processes that affect cell diversification from a single set of genes. Regulatory proteins often interact with DNA regions located distally from the transcription start sites (TSS) of the genes. We developed a computational method that combines open chromatin and gene expression information for a large number of cell types to identify these distal regulatory elements. Our method builds correlation graphs for publicly available DNase-seq and exon array datasets with matching samples and uses graph-based methods to filter findings supported by multiple datasets and remove indirect interactions. The resulting set of interactions was validated with both anecdotal information of known long-range interactions and unbiased experimental data deduced from Hi-C and CAGE experiments. Our results provide a novel set of high-confidence candidate open chromatin regions involved in gene regulation, often located several Mb away from the TSS of their target gene.